Activity 1: Assessment. Estimated duration: 4 min
Assessment with 4 questions from Comparing Representations of Data.
4 questions assessment

Created by Jen K (Kind Placebo) on
8 activities: 7 games, 1 assessment
88 minActivity 1: Assessment. Estimated duration: 4 min
4 questions assessment
Activity 2: Instructional Game. Estimated duration: 12 min
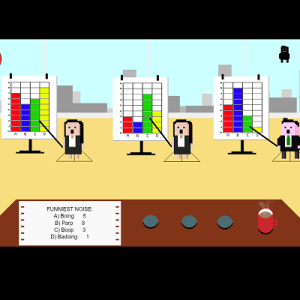
Recruit and ruthlessly fire applicants for jobs at your company based on their ability to turn data into bar and line graphs!
Teacher Ratings (14) 4.2 stars.
Student Ratings (3309) 3.7 stars.
Activity 3: Instructional Game. Estimated duration: 8 min
Sam and Max are confused and need your help to understand how to analyze and compare data. Help them on their journey and discover the best way to display charts, bar graphs, line and stem plots!

Teacher Ratings (8) 4.5 stars.
Student Ratings (3094) 3.4 stars.
Activity 4: Instructional Game. Estimated duration: 8 min
In this game, you're using a bar graph to answer questions about the amount of fruit being taken to market. You'll figure out how much more of one fruit you see than another, how much you have of each fruit, and how to find the total amount of fruit in each crate by multiplying!

Teacher Ratings (23) 4.2 stars.
Student Ratings (6699) 4.0 stars.
Activity 5: Instructional Game. Estimated duration: 22 min
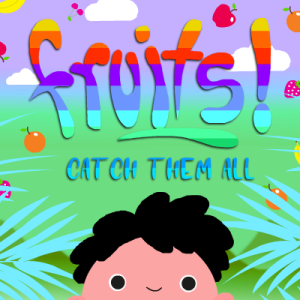
Complete the bar graphs, answer the questions, and help our friend to capture the fruits!
Teacher Ratings (62) 4.4 stars.
Student Ratings (7283) 3.9 stars.
Activity 6: Question Game. Estimated duration: 12 min
Shoot a basketball through the hoop and answer some questions along the way! The game does not have any instructional content, it simply has review questions spread throughout.

Teacher Ratings (998) 4.0 stars.
Student Ratings (308845) 3.9 stars.
Activity 7: Instructional Game. Estimated duration: 11 min
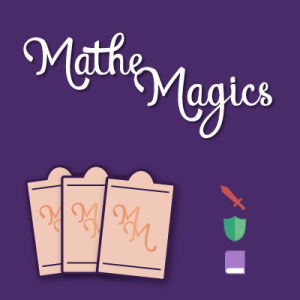
Play a card battle comparing values of different types of graphs. The card battles become more challenging as you keep playing. Choose your strategy wisely to win, and get deep to the challenge trying to get to 3 stars!
Teacher Ratings (9) 4.0 stars.
Student Ratings (1884) 3.9 stars.
Activity 8: Instructional Game. Estimated duration: 11 min
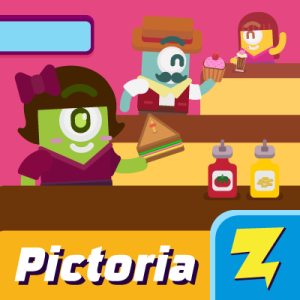
A yummy new restaurant has just opened and Mathlings are swarming in to order their speciality dishes! With all these orders, the restaurant cannot seem to determine which orders have the most demand from the customers. Help us find out the correct food ordered by customers. In this game by Zapzapmath, students will learn to use picture graphs.
Teacher Ratings (25) 4.2 stars.
Student Ratings (3480) 3.5 stars.