Assignment: Draw And Solve Problems With A Scaled Bar Graph NC.3.MD.3 Assignment

Created by Aubrie C on

8 activities: 8 games

84 min

Activity 1: Question Game. Estimated duration: 20 min

Educagent

You are tasked with infiltrating the headquarters of a corrupt corporation. You must make it to the mainframe computer on the top floor to collect evidence for an investigation.

Ratings

Teacher Ratings (215) 4.2 stars.

Student Ratings (153020) 3.8 stars.

Activity 2: Instructional Game. Estimated duration: 18 min

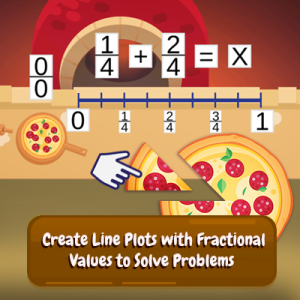
Pizza Fractions

Think of fractions as pizza cuts! Place fraction values on to the line plot and solve math problems involving fractions!

Ratings

Teacher Ratings (24) 3.9 stars.

Student Ratings (3403) 3.4 stars.

Activity 3: Video Game. Estimated duration: 5 min

Draw And Solve Problems With A Scaled Bar Graph

Draw a scaled picture graph and a scaled bar graph to represent a data set with several categories. Solve one- and two-step “how many more” and “how many less” problems using information presented in scaled bar graphs.

Ratings

Teacher Ratings (2) 5.0 stars.

Student Ratings (854) 3.6 stars.

Activity 4: Instructional Game. Estimated duration: 18 min

Pizza Fractions

Think of fractions as pizza cuts! Place fraction values on to the line plot and solve math problems involving fractions!

Ratings

Teacher Ratings (24) 3.9 stars.

Student Ratings (3403) 3.4 stars.

Activity 5: Video Game. Estimated duration: 5 min

Draw And Solve Problems With A Scaled Bar Graph

Draw a scaled picture graph and a scaled bar graph to represent a data set with several categories. Solve one- and two-step “how many more” and “how many less” problems using information presented in scaled bar graphs.

Ratings

Teacher Ratings (2) 5.0 stars.

Student Ratings (854) 3.6 stars.

Activity 6: Video Game. Estimated duration: 5 min

Draw And Solve Problems With A Scaled Bar Graph

Draw a scaled picture graph and a scaled bar graph to represent a data set with several categories. Solve one- and two-step “how many more” and “how many less” problems using information presented in scaled bar graphs.

Ratings

Teacher Ratings (2) 5.0 stars.

Student Ratings (854) 3.6 stars.

Activity 7: Instructional Game. Estimated duration: 8 min

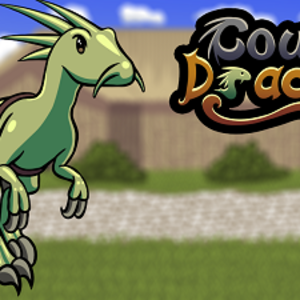
Dragon Courier

In this game, you're using a bar graph to answer questions about the amount of fruit being taken to market. You'll figure out how much more of one fruit you see than another, how much you have of each fruit, and how to find the total amount of fruit in each crate by multiplying!

Ratings

Teacher Ratings (23) 4.2 stars.

Student Ratings (6701) 4.0 stars.

Activity 8: Video Game. Estimated duration: 5 min

Draw And Solve Problems With A Scaled Bar Graph

Draw a scaled picture graph and a scaled bar graph to represent a data set with several categories. Solve one- and two-step “how many more” and “how many less” problems using information presented in scaled bar graphs.

Ratings

Teacher Ratings (2) 5.0 stars.

Student Ratings (854) 3.6 stars.