Activity 1: Assessment. Estimated duration: 5 min
Assessment with 5 questions from Measures of Central Tendency and Variation.
5 questions assessment
Created by Jen K on
6 activities: 5 games, 1 assessment
70 minActivity 1: Assessment. Estimated duration: 5 min
5 questions assessment
Activity 2: Question Game. Estimated duration: 12 min
Shoot a basketball through the hoop and answer some questions along the way! The game does not have any instructional content, it simply has review questions spread throughout.

Teacher Ratings (1035) 4.0 stars.
Student Ratings (323055) 4.0 stars.
Activity 3: Question Game. Estimated duration: 20 min
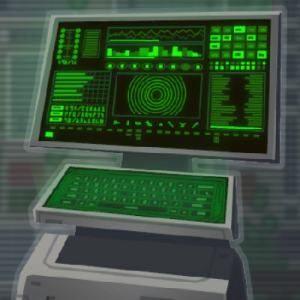
You are tasked with infiltrating the headquarters of a corrupt corporation. You must make it to the mainframe computer on the top floor to collect evidence for an investigation.
Teacher Ratings (215) 4.2 stars.
Student Ratings (153241) 3.8 stars.
Activity 4: Instructional Game. Estimated duration: 8 min
Hunt and capture numerous slimes, who are invading the land, for research and study purpose! Find important data by defining mean, median and quartile.

Teacher Ratings (18) 4.0 stars.
Student Ratings (3246) 2.9 stars.
Activity 5: Instructional Game. Estimated duration: 10 min
The Ancient Enigma has challenged you to solve its riddles for treasure! In this game by Zapzapmath, students will recognize that a measure of center for a numerical data set summarizes all of its values with a single number, while a measure of variation can describe how its values vary.

Teacher Ratings (18) 4.1 stars.
Student Ratings (4103) 3.3 stars.
Activity 6: Instructional Game. Estimated duration: 15 min
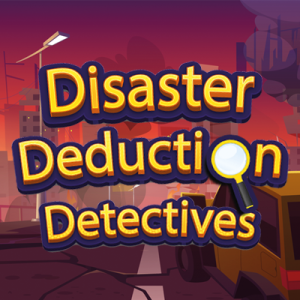
Disaster Deduction Detectives is a four-level game to teach mean, median and basic statistics in context. Students will learn how data tracking and analysis can support important decisions made in real-world scenarios. Through the game, students will be introduced to the concepts of statistical questions and data as well as ways to analyze them. Students will then calculate the mean and median using multiple real-world data sets. Students will be introduced to data visualization through dot plots, variability and the concept of outliers.
Teacher Ratings (3) 3.7 stars.
Student Ratings (189) 2.8 stars.